In this article we demonstrate how to use H.OxyPlot to draw diagrams and charts in a WinUI 3 .NET 6 desktop application. We created a sample app with different pages that cover:
- the ‘Hello World’ diagram,
- an overview of many of the supported charts,
- working with an interactive model, and
- instant theming support.
Here’s how the app looks like:
It’s our first Visual Studio 2022 .NET 6 app. In some of these pages we test drive the new version of the Microsoft MVVM Toolkit, but our focus remains on OxyPlot.
OxyPlot
OxyPlot is an Open Source .NET library for drawing diagrams and charts on multiple platforms. It comes with a core object model for models, series, axes, annotations etcetera. Further there’s a RenderContext / PlotView pair for each UI technology: WPF, WinForms, SkiaSharp, UWP, Xamarin, … Windows Phone and Silverlight. The different PlotView implementations are relatively simple – a Canvas and a crosshair Tracker. The complexity of the UI platform specific items lies in the RenderContext implementations that physically draw the PlotModel’s colors, brushes, fonts, lines, ellipses, and geometries. Take a look at the renderers for WinUI 3, Windows Forms, Skia, and WPF.
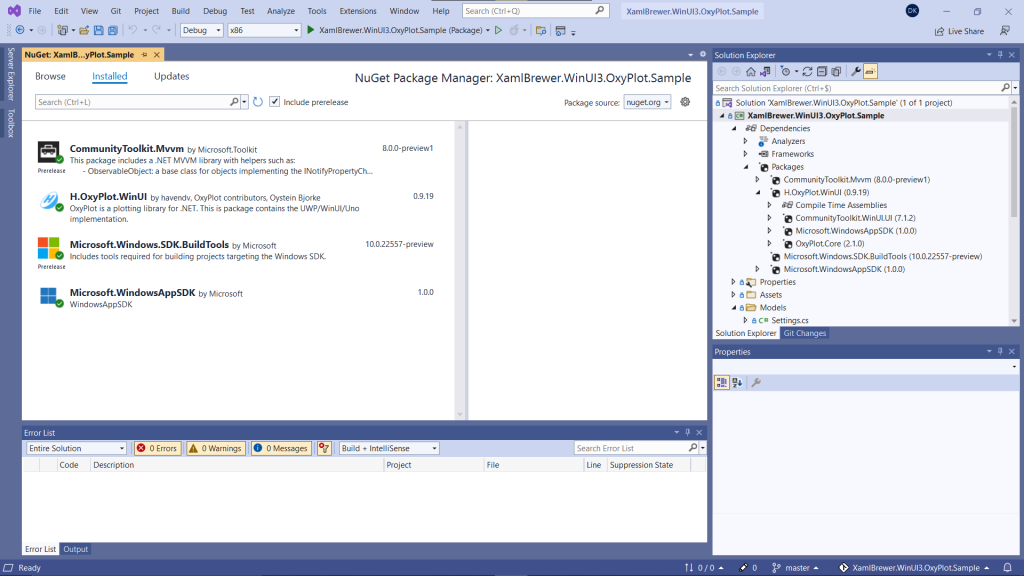
The OxyPlot team is currently very busy refactoring its core code. They’re not focusing on creating PlotViews or RenderContexts for the more recent .NET UI platforms like WinUI 3. This is where H.OxyPlot comes in. H.OxyPlot is a project that provides UWP, WinUI 3, and Uno support for the latest OxyPlot core library. It combines the (abandoned) OxyPlot UWP code with the current version of the WPF code. It tries to match the latter as closely as possible in behavior, while adding some extra features – like Dark Theme support. It’s this version that we use in our sample app. Here’s an overview of that app’s dependencies:
Hello World
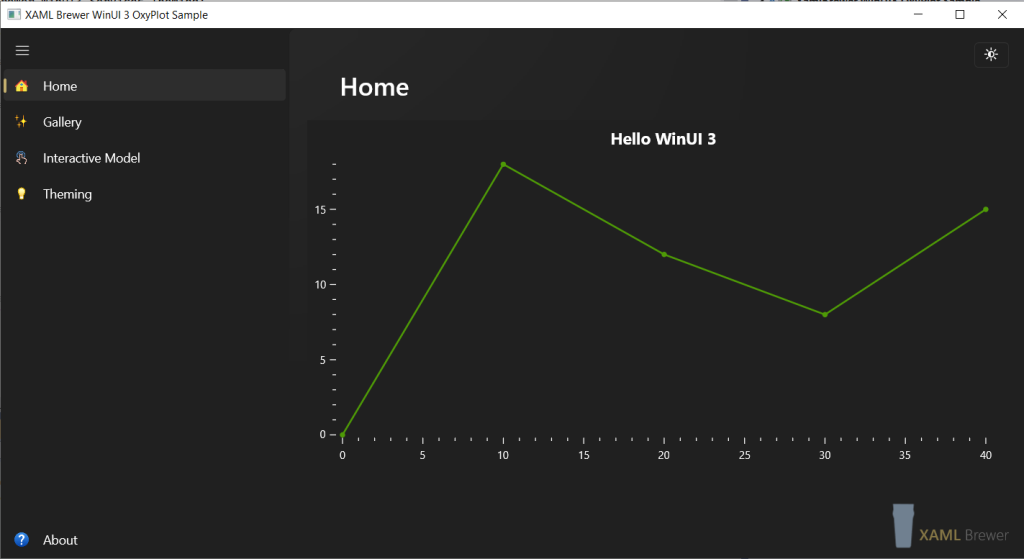
The HomePage of our sample app shows OxyPlot usage in its simplest form. The page exposes a PlotModel property: a model consisting of two axes and one line series with just a handful of points:
public PlotModel Model { get; private set; } = new PlotModel
{
    Title = "Hello WinUI 3",
    PlotAreaBorderColor = OxyColors.Transparent,
    Axes =
    {
        new LinearAxis { Position = AxisPosition.Bottom },
        new LinearAxis { Position = AxisPosition.Left },
    },
    Series =
    {
        new LineSeries
        {
            Title = "LineSeries",
            MarkerType = MarkerType.Circle,
            Points =
            {
                new DataPoint(0, 0),
                new DataPoint(10, 18),
                new DataPoint(20, 12),
                new DataPoint(30, 8),
                new DataPoint(40, 15),
            }
        }
    }
};
The PlotModel is bound to a PlotView in the page declaration:
<oxy:PlotView Model="{x:Bind Model}" />
That’s all there is! Here’s how the Hello World page looks like:
Model Gallery
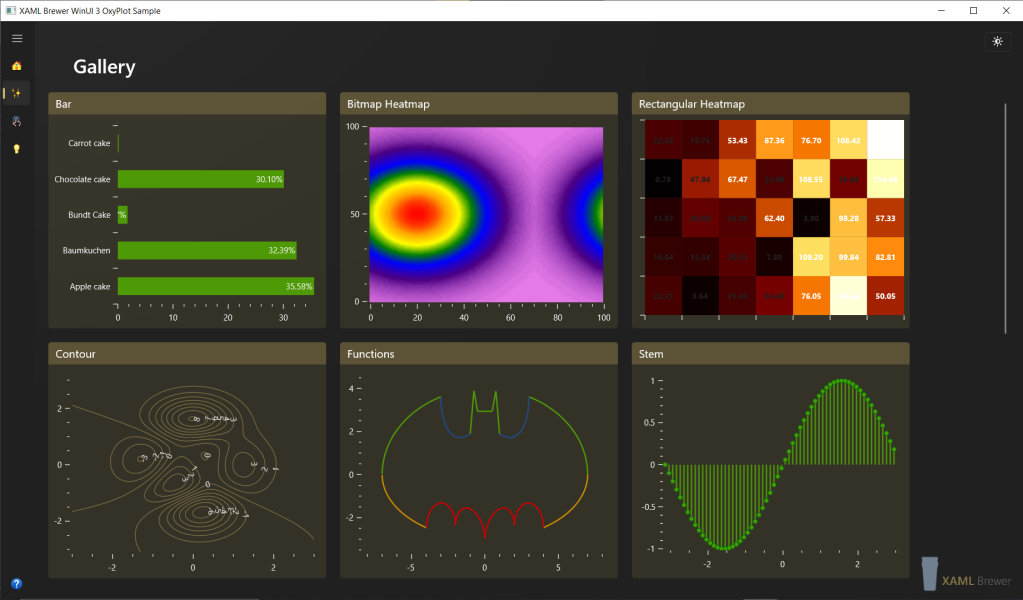
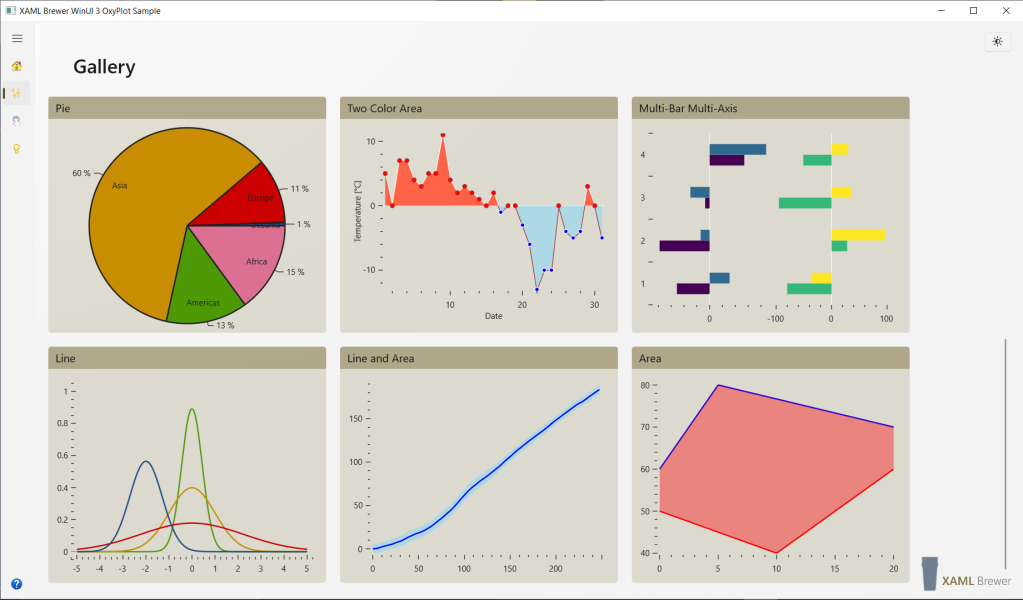
We mentioned that the OxyPlot core components are being refactored, and that the WinUI 3 controls are brand new. That sounds like thin ice to walk on, no? Well, to get an idea of the state of both projects and their usability in production quality apps, we decided to create a page with as much different models as possible. All of these diagrams were straight copied from the official OxyPlot samples repository. We just removed titles and legends.
Welcome to the Model Gallery page. Here’s how it looks like:
The page has its own ViewModel that exposes different PlotModel properties. The ViewModel is declared as DataContext of the page – classic MVVM style:
<Page.DataContext>
    <viewmodels:MultiPageViewModel x:Name="ViewModel" />
</Page.DataContext>
All PlotModels are declaratively bound to PlotView instances:
<oxyplot:PlotView Model="{x:Bind ViewModel.BarSeriesModel}" />
Here’s the ViewModel code for the PieSeries model property:
pieSeriesModel = new PlotModel();

pieSeriesModel.PlotAreaBorderColor = OxyColors.Transparent;

    dynamic seriesP1 = new PieSeries
    {
        StrokeThickness = 2.0,
        InsideLabelPosition = 0.8,
        AngleSpan = 360,
        StartAngle = 0
    };

seriesP1.Slices.Add(new PieSlice("Africa", 1030)
    {
        IsExploded = false,
        Fill = OxyColors.PaleVioletRed
    });
seriesP1.Slices.Add(new PieSlice("Americas", 929)
    {
        IsExploded = true
    });
seriesP1.Slices.Add(new PieSlice("Asia", 4157)
    {
        IsExploded = true
    });
seriesP1.Slices.Add(new PieSlice("Europe", 739)
    {
        IsExploded = true
    });
seriesP1.Slices.Add(new PieSlice("Oceania", 35)
    {
        IsExploded = true
    });

pieSeriesModel.Series.Add(seriesP1);
All diagrams are defined and created in exactly the same way, and the corresponding PlotViews are hooked in a VariableSizedWrapGrid. When the window is resized, we let all items move smoothly to their new position with a RepositionThemeTransition:
<GridViewItem.Transitions>
    <TransitionCollection>
        <RepositionThemeTransition />
    </TransitionCollection>
</GridViewItem.Transitions>
We did not observe any annoying performance or rendering issue that would make us decide not to use OxyPlot or H.OxyPlot in a production app. So, on to another test.
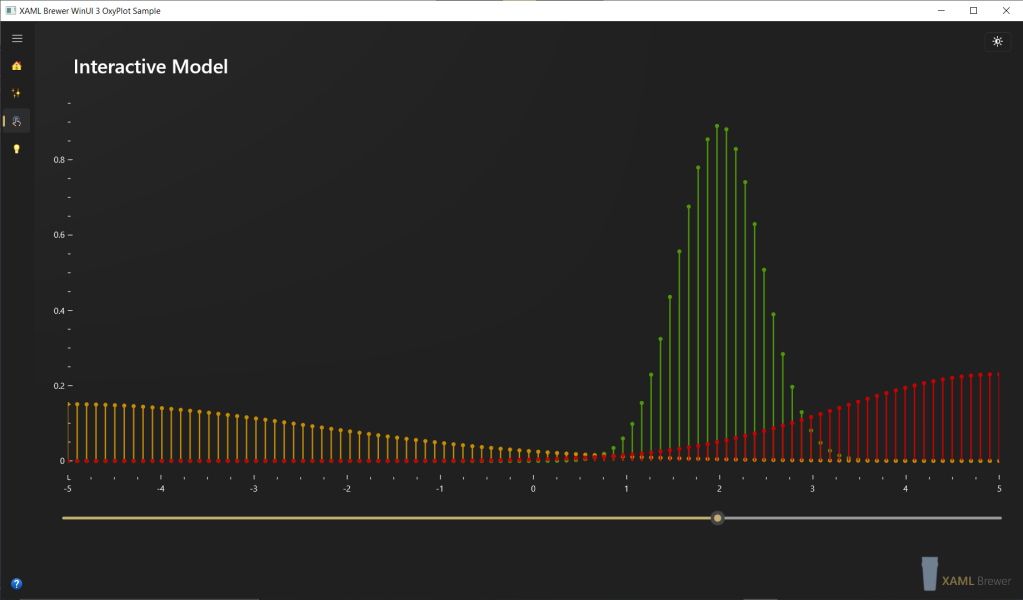
Interactive Model
Sometimes we need to display a chart with ever changing, dynamic data. Our sample app has a page to simulate this. The Interactive Model page has a PlotView populated with three StemSeries picturing differently parameterized normal distributions. With a Slider below the diagram, you can change the mean and the variance of the distributions. It will update all series in more or less real time. Here’s how it looks like in action:
Again, we use a ViewModel. Here are its main properties:
public PlotModel Model => model;

public double Variance
{
    get => variance;
    set
    {
        SetProperty(ref variance, value);
        updateSeries();
    }
}
The page controls are bound to these properties:
<oxyplot:PlotView Model="{x:Bind ViewModel.Model}"
                    Background="Transparent" />
<Slider Value="{x:Bind ViewModel.Variance, Mode=TwoWay}"
        Minimum="-5"
        Maximum="5"
        StepFrequency=".25"
        Margin="20 0 10 0"
        Grid.Row="1" />
Observe that the PlotView uses {x:Bind} with its default mode: OneTime. There’s no need to use classic data binding here. The PlotModel knows its PlotView and can broadcast its updates itself. It does not do this automatically – you’ll need an InvalidatePlot() call, like the one at the end of the following method. The call has a true parameter to indicate that the data was changed (and things like axes minima and maxima need to be recalculated):
private void updateSeries()
{
    model.Series.Clear();
    model.Series.Add(CreateNormalDistributionSeries(-5, 5, Variance, 0.2));
    model.Series.Add(CreateNormalDistributionSeries(-5, 5, -5, 5 + Variance));
    model.Series.Add(CreateNormalDistributionSeries(-5, 5, 5, 5 - Variance));

    model.InvalidatePlot(true);
}
In scenarios with very high update frequency of very large data series, you may not get the performance that you would like. In that case we advise you to look for (or develop) an OxyPlot PlotView/RenderContext pair that’s based on SkiaSharp. The SkiaSharp WPF rendering pretends to be 100 times faster than the WPF Canvas. We did not find a WinUI 3 compatible version of such a view…
Instant Theming
OxyPlot was developed way before Dark Theme or instant theming were a thing: models natively come a white background and black titles, axis lines and labels. If you want to change that, you need to recolor everything individually. H.OxyPlot (the WinUI 3 / Uno version) on the other hand adds a nice feature: it has with built-in support for a Dark Theme, and it uses a great trick for this. When the RequestedTheme is dark, the RenderContext reverses black and white by swapping the cached brushes for these colors:
if (color == OxyColors.Black)
{
    color = OxyColors.White;
}
else if (color == OxyColors.White)
{
    color = OxyColor.FromArgb(255, 32, 32, 32);
}
This looks too simply to be true, but it works surprisingly well for most of the diagram types.
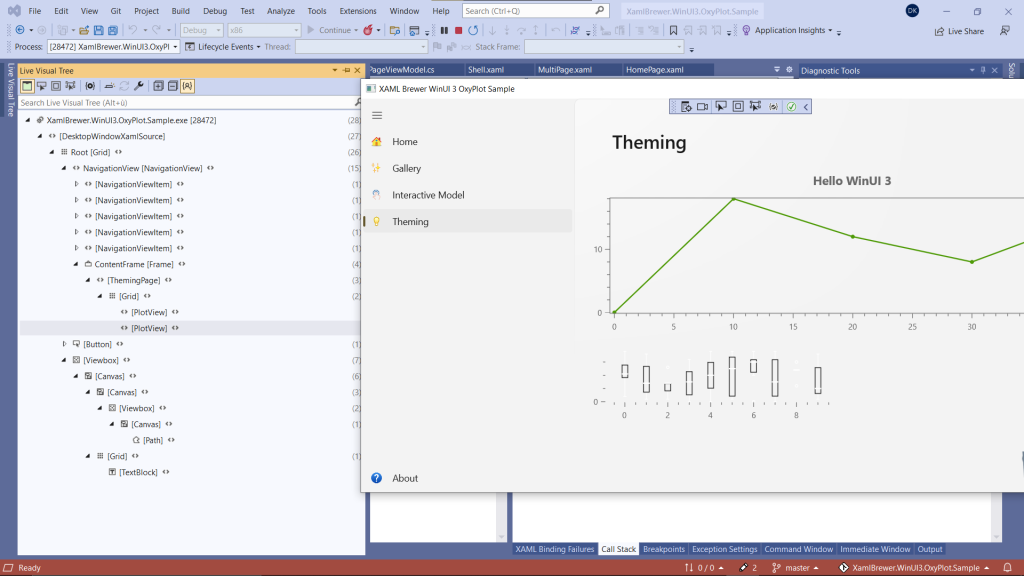
In our sample app we wanted to take it a step further and support instant theme switching. We created a page with a copy of the Hello World model, and some other ones.
OxyPlot comes with its own color classes. This should not come as a surprise, since every .NET UI stack also has its own. But for XAML developers, that means that you cannot (at least directly) rely on Theme resource dictionaries. And even if the brushes and colors were compatible, XAML theming, styling, and templating would still not work. The PlotView is a Canvas on the outside, but apart from the crosshair Tracker there’s no XAML in it. Here’s a screenshot of the Live Visual Tree:
We couldn’t resist, and actually did some XAML theming. We replaced the black crosshair Tracker lines by the system accent color:
<oxy:PlotView.DefaultTrackerTemplate>
    <ControlTemplate>
        <oxy1:TrackerControl Position="{Binding Position}"
                                LineStroke="{ThemeResource SystemColorControlAccentBrush}"
                                Background="GhostWhite">
            <oxy1:TrackerControl.Content>
                <TextBlock Text="{Binding}"
                            Margin="5" />
            </oxy1:TrackerControl.Content>
        </oxy1:TrackerControl>
    </ControlTemplate>
</oxy:PlotView.DefaultTrackerTemplate>
And we like wat we see – in Dark as well as Light themes:
Let’s go back to instant theming. When the Theme is changed, we change the color of all text elements in the Hello World model, as well as the color of the axes and their ticks:
var foreground = theme == ElementTheme.Light
    ? OxyColor.FromRgb(32, 32, 32)
    : OxyColors.WhiteSmoke;

helloWorldmodel.TextColor = foreground;
foreach (var axis in helloWorldmodel.Axes)
{
    axis.TicklineColor = foreground;
    axis.AxislineColor = foreground;
}
We refactored this code into an extension method that toggles the color of all non-transparent items of these types:
public static void ApplyTheme(this PlotModel plotModel, ElementTheme theme)
{
    var foreground = theme == ElementTheme.Light
        ? OxyColor.FromRgb(32, 32, 32)
        : OxyColors.WhiteSmoke;

    if (plotModel.TextColor != OxyColors.Transparent)
    {
        plotModel.TextColor = foreground;
    }

    foreach (var axis in plotModel.Axes)
    {
        if (axis.TicklineColor != OxyColors.Transparent)
        {
            axis.TicklineColor = foreground;
        }
        if (axis.AxislineColor != OxyColors.Transparent)
        {
            axis.AxislineColor = foreground;
        }
    }

    plotModel.InvalidatePlot(false);
}
We made this extension method run against all the models in the Model Gallery page. It may need some fine tuning but so far, we are happy with the result – check the screenshots above.
There’s more in a diagram than texts and axes: some of the series might also need some theming support. Most of the bars, lines, columns, dots, and areas look very good if you apply a decent color scheme. If the series’ shapes have a fill color and borders or decorations (e.g., an area series has a fill, upper border and lower border), then you may need some extra code for theming support.
A first example is the boxplot chart in the lower left corner. We assigned it two matching colors (a light and a dark) and swap these when the theme changes:
var series = boxPlotModel.Series[0] as BoxPlotSeries;
if (theme == ElementTheme.Light)
{
    series.Fill = OxyColors.LightSteelBlue;
    series.Stroke = OxyColors.LightSlateGray;
}
else
{
    series.Fill = OxyColors.LightSlateGray;
    series.Stroke = OxyColors.LightSteelBlue;
}
Another way of blending the shapes of a series better into the theme, is make them semi-transparent. As a bonus there’s no extra code to execute when the theme changes. That’s what we did to the pie chart in the lower right corner of the test page:
foreach (var slice in (pieChartModel.Series.First() as PieSeries).Slices)
{
    var color = slice.ActualFillColor;
    slice.Fill = OxyColor.FromArgb(90, color.R, color.G, color.B);
}
Here’s how all of this looks like:

For the sake of completion, here’s how the instant theming support is implemented. When the page is loaded and all controls are accessible, we apply the current theme:
public InteractivePage()
{
    InitializeComponent();
    Loaded += Page_Loaded;
}

private void Page_Loaded(object sender, RoutedEventArgs e)
{
    ApplyTheme(ActualTheme);
}

private void ApplyTheme(ElementTheme theme)
{
    ViewModel.Model.ApplyTheme(theme);
}
As long as the page is active, we listen to ActualThemeChanged and react appropriately:
protected override void OnNavigatedTo(NavigationEventArgs e)
{
    ActualThemeChanged += Page_ActualThemeChanged;
    base.OnNavigatedTo(e);
}

protected override void OnNavigatedFrom(NavigationEventArgs e)
{
    ActualThemeChanged -= Page_ActualThemeChanged;
    base.OnNavigatedFrom(e);
}

private void Page_ActualThemeChanged(FrameworkElement sender, object args)
{
    ApplyTheme(sender.ActualTheme);
}
The exact same logic is applied in the Model Gallery page and the Interactive Model page. And of course, we also tested everything in an app that’s more representative than our small sample. Here’s the result:
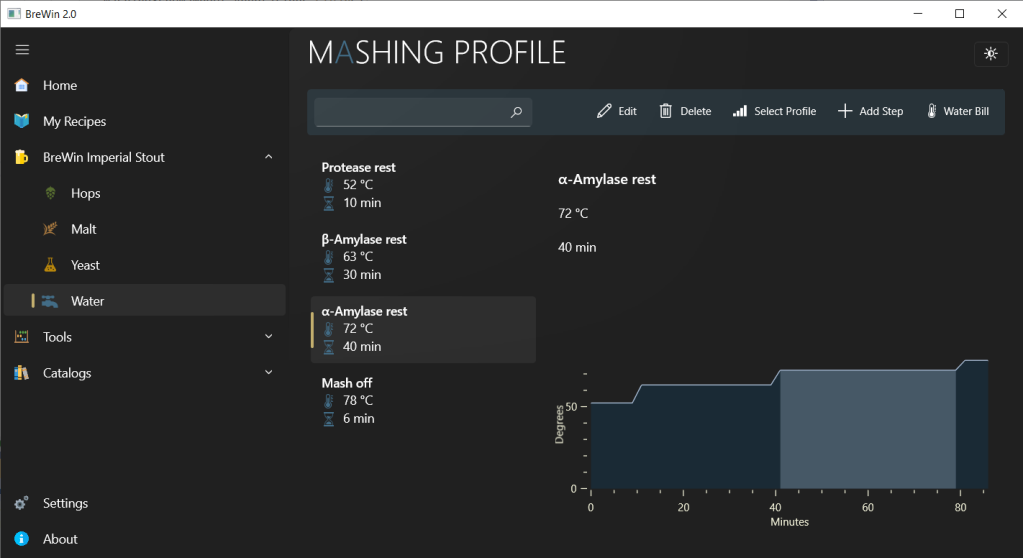
It’s one of the many pages to which we also applied our Master-Detail pattern. We added an area chart that supports instant theming. Since this type of chart does not allow to select an item (like a bar, a column, or a pie slice) we decorated it with a RectangleAnnotation to highlight the selected zone.
The Verdict
In our sample app we demonstrated how to use H.OxyPlot to draw diagrams and charts in a WinUI 3 .NET 6 desktop application. The project definitely meets enterprise development standards, and it sets the bar high for third party paid components.
Our sample app lives here on GitHub.
Enjoy!
