This is the second in a series of articles on implementing Machine Learning scenarios with ML.NET and OxyPlot in UWP apps. If you’re looking for an introduction to these technologies, please check part one of this series. In this article we will build, train, evaluate, and consume a multiclass classification model to detect the language of a piece of text.
All blog posts in this series are based on a single sample app that lives here on GitHub.
Classification
Classification in Machine Learning
Classification is a technique from supervised learning to categorize data into a desired number of labeled classes. In binary classification the prediction yields one of two possible outcomes (basically solving ‘true or false’ problems). This article however focuses on multiclass classification, where the prediction model has two or more possible outcomes.
Here are some real-world classification scenario’s:
- road sign detection in self-driving cars,
- spoken language understanding,
- market segmentation (predict if a customer will respond to marketing campaign), and
- classification of proteins according to their function.
There’s a wide range of multiclass classification algorithms available. Here are the most used ones:
- k-Nearest Neighbors learns by example. The model is a so-called lazy one: it just stores the training data, all computation is deferred. At prediction time it looks up the k closest training samples. It’s very effective on small training sets, like in the face recognition on your mobile phone.
- Naive Bayes is a family of algorithms that use principles from the field of probability theory and statistics. It is popular in text categorization and medical diagnosis.
- Regression involves fitting a curve to numeric data. When used for classification, the resulting numerical value must be transformed back into a label. Regression algorithms have been used to identify future risks for patients, and to predict voting intent.
- Classification Trees and Forests use flowchart-like structures to make decisions. This family of algorithms is particularly useful when transparency is needed, e.g. in loan approval or fraud detection.
- A set of Binary Classification algorithms can be made to work together to form a multiclass classifier using a technique called ‘One-versus-All’ (OVA).
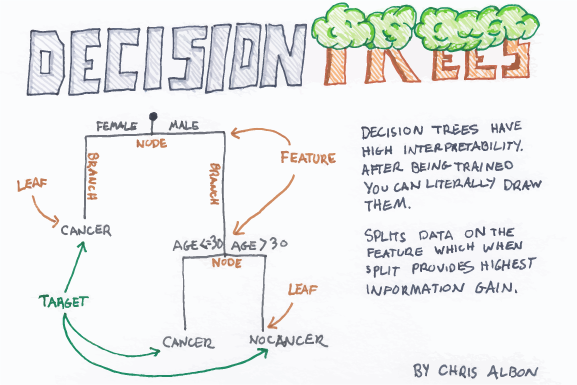
If you want to know more about classification then check this straightforward article. It is richly illustrated with Chris Albon’s awesome flash cards like this one:
Classification in ML.NET
ML.NET covers all the major algorithm families and more with the following multiclass classification learners:
- LightGbmMulticlassTrainer
- MetaMulticlassTrainer<TTransformer,TModel>
- MultiClassNaiveBayesTrainer
- Ova
- Pkpd
- SdcaMultiClassTrainer
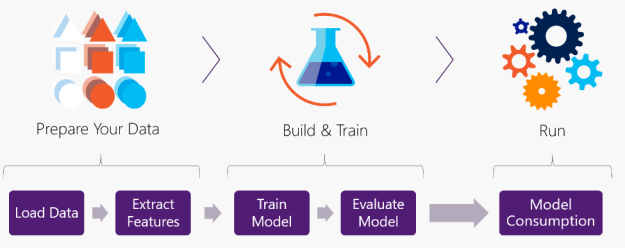
The API allows to implement the following flow:
When we dive into the code, you’ll recognize that same pattern.
Building a Language Recognizer
The case
In this article we’ll build and use a model to detect the language of a piece of text from a set of languages. The model will be trained to recognize English, German, French, Italian, Spanish, and Romanian. The training and evaluation datasets (and a lot of the code) are borrowed from this project by Dirk Bahle.
Safety Instructions
In the previous article, we explained why we’re using v0.6 of the ML.NET API instead of the current one (v0.9). There is some work to be done by different Microsoft teams to adjust the UWP/.NET Core/ML.NET components to one another.
The sample app works pretty well, as long as you comply with the following safety instructions:
- don’t upgrade the ML.NET NuGet package,
- don’t run the app in Release mode, and
- always bend your knees not your back when lifting heavy stuff.
In the last couple of iterations the ML.NET team has been upgrading its API from the original Microsoft internal .NET 1.0 code to one that is on par with other Machine Learning frameworks. The difference is huge! A lot of the v0.6 classes that you encounter in this sample are now living in the Legacy namespace or were even removed from the package.
As far as possible we’ll try to point the hyperlinks in this article to the corresponding members in the newer API. The documentation on older versions is continuously cleaned up and we don’t want you to end up on this page:
If you want to know multiclass classification looks like in the newest API, then check this official sample.
Alternative Strategy
We can imagine that some of you don’t want to wait for all pieces of the technical puzzle to come together, or are reluctant to use ML.NET in UWP. Allow us to promote an alternative approach. WinML is an inference engine to use trained local ONNX machine learning models in your Windows apps. Not all end user (UWP) apps are interested in model training – they only want the use a model for running predictions. You can build, train, and evaluate a Machine Learning model in a C# console app with ML.NET, then save it as ONNX with this converter, then load and consume it in a UWP app with WinML:
The ML.NET console app can be packaged, deployed and executed as part of your UWP app by including it as a full trust desktop extension. In this configuration the whole solution can even be shipped to the store.
The Code
A Lottie-driven busy indicator
Depending on the algorithm family, training and using a machine learning model can be CPU intensive and time consuming. To entertain the end user during these processes and to verify that these does not block the UI, we added an extra element to the page. An UWP Lottie animation will play the role of a busy indicator:
<lottie:LottieAnimationView
	x:Name="BusyIndicator"
	FileName="Assets/loading.json"
	Visibility="Collapsed" />
When the load-build-train-test-save-consume scenario starts, the image will become visible and we start the animation:
BusyIndicator.Visibility = Windows.UI.Xaml.Visibility.Visible;
BusyIndicator.PlayAnimation();
Here’s how this looks like:
When the action stops, we hide the control and pause the animation:
BusyIndicator.Visibility = Windows.UI.Xaml.Visibility.Collapsed;
BusyIndicator.PauseAnimation();
As explained in the previous article, we moved all machine model processing of the main UI thread by making it awaitable:
public Task Train()
{
    return Task.Run(() =>
    {
        _model.Train();
    });
}
Load data
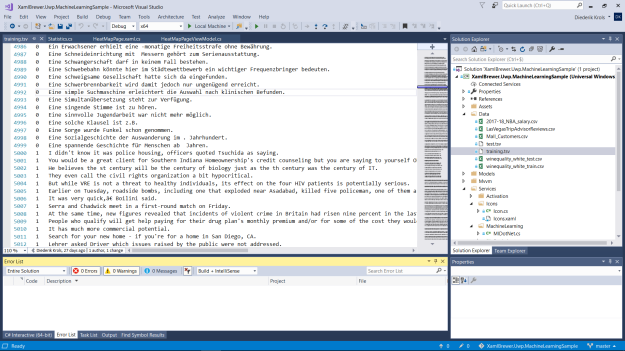
The training dataset is a TAB separated value file with the labeled input data: an integer corresponding to the language, and some text:
The input data is modeled through a small class. We use the Column attribute to indicate column sequence number in the file, and special names for the algorithm. Supervised learning algorithms always expect a “Label” column in the input:
public class MulticlassClassificationData
{
    [Column(ordinal: "0", name: "Label")]
    public float LanguageClass;

    [Column(ordinal: "1")]
    public string Text;

    public MulticlassClassificationData(string text)
    {
        Text = text;
    }
}
The output of the classification model is a prediction that contains the predicted language (as a float – just like the input) and the confidence percentages for all languages. We used the ColumnName attribute to link the class members to these output columns:
public class MulticlassClassificationPrediction
{
    private readonly string[] classNames = { "German", "English", "French", "Italian", "Romanian", "Spanish" };

    [ColumnName("PredictedLabel")]
    public float Class;

    [ColumnName("Score")]
    public float[] Distances;

    public string PredictedLanguage => classNames[(int)Class];

    public int Confidence => (int)(Distances[(int)Class] * 100);
}
The MVVM Model has properties to store the untrained model and the trained model, respectively a LearningPipeline and a PredictionModel:
public LearningPipeline Pipeline { get; private set; }

public PredictionModel<MulticlassClassificationData, MulticlassClassificationPrediction> Model { get; private set; }
We used the ‘classic’ text loader from the Legacy namespace to load the data sets, so watch the using statement:
using TextLoader = Microsoft.ML.Legacy.Data.TextLoader;
The first step in the learning pipeline is loading the raw data:
Pipeline = new LearningPipeline();
Pipeline.Add(new TextLoader(trainingDataPath).CreateFrom<MulticlassClassificationData>());
Extract features
To prepare the data for the classifier, we need to manipulate both incoming fields. The label does not represent a numerical series but a language. So with a Dictionarizer we create a ‘bucket’ for each language to hold the texts. The TextFeaturizer populates the Features column with a numeric vector that represents the text:
// Create a dictionary for the languages. (no pun intended)
Pipeline.Add(new Dictionarizer("Label"));

// Transform the text into a feature vector.
Pipeline.Add(new TextFeaturizer("Features", "Text"));
Train model
Now that the data is prepared, we can hook the classifier into the pipeline. As already mentioned, there are multiple candidate algorithms here:
// Main algorithm
Pipeline.Add(new StochasticDualCoordinateAscentClassifier());
// or
// Pipeline.Add(new LogisticRegressionClassifier());
// or
// Pipeline.Add(new NaiveBayesClassifier()); // yields weird metrics...
The predicted label is a vector, but we want one of our original input labels back – to map it to a language. The PredictedLabelColumnsOriginalValueConverter does this:
// Convert the predicted value back into a language.
Pipeline.Add(new PredictedLabelColumnOriginalValueConverter()
    {
        PredictedLabelColumn = "PredictedLabel"
    }
);
The learning pipeline is complete now. We can train the model:
public void Train()
{
    Model = Pipeline.Train<MulticlassClassificationData, MulticlassClassificationPrediction>();
}
The trained machine learning model can be saved now:
public void Save(string modelName)
{
    var storageFolder = ApplicationData.Current.LocalFolder;
    using (var fs = new FileStream(
        Path.Combine(storageFolder.Path, modelName),
        FileMode.Create,
        FileAccess.Write,
        FileShare.Write))
        Model.WriteAsync(fs);
}
Evaluate model
In supervised learning you can evaluate a trained model by providing a labeled input test data set and see how the predictions compare against it. This gives you an idea of the accuracy of the model and indicates whether you need to retrain it with other parameters or another algorithm.
We create a ClassificationEvaluator for this, and inspect the ClassificationMetrics that return from the Evaluate() call:
public ClassificationMetrics Evaluate(string testDataPath)
{
    var testData = new TextLoader(testDataPath).CreateFrom<MulticlassClassificationData>();

    var evaluator = new ClassificationEvaluator();
    return evaluator.Evaluate(Model, testData);
}
Some of the returned metrics apply to the whole model, some are calculated per label (language). The following diagram presents the Logarithmic Loss of the classifier per language (the PerClassLogLoss field). Loss represents a degree of uncertainty, so lower values are better:
Observe that some languages are harder to detect than others.
Model consumption
The Predict() call takes a piece of text and returns a prediction:
public MulticlassClassificationPrediction Predict(string text)
{
    return Model.Predict(new MulticlassClassificationData(text));
}
The prediction contains the predicted language and a set of scores for each language. Here’s what we do with this information in the sample app:
We are pretty impressed to see how easy it is to build a reliable detector for 6 languages. The trained model would definitely make sense in a lot of .NET applications that we developed in the last couple of years.
Visualizing the results
We decided to use OxyPlot for visualizing the data in the sample app, because it’s light-weight and it does all the graphs we needed. In the previous article in this series we created all the elements programmatically. So this time we’ll focus on the XAML.
Axes and Series
Here’s the declaration of the PlotView with its PlotModel. The model has a CategoryAxis for the languages and a LinearAxis for the log-loss values. The values are represented in a BarSeries:
<oxy:PlotView x:Name="Diagram"
                Background="Transparent"
                BorderThickness="0"
                Margin="0 0 40 60"
                Grid.Column="1">
    <oxy:PlotView.Model>
        <oxyplot:PlotModel Subtitle="Model Quality"
                            PlotAreaBorderColor="{x:Bind OxyForeground}"
                            TextColor="{x:Bind OxyForeground}"
                            TitleColor="{x:Bind OxyForeground}"
                            SubtitleColor="{x:Bind OxyForeground}">
            <oxyplot:PlotModel.Axes>
                <axes:CategoryAxis Position="Left"
                                    ItemsSource="{x:Bind Languages}"
                                    TextColor="{x:Bind OxyForeground}"
                                    TicklineColor="{x:Bind OxyForeground}"
                                    TitleColor="{x:Bind OxyForeground}" />
                <axes:LinearAxis Position="Bottom"
                                    Title="Logarithmic loss per class (lower is better)"
                                    TextColor="{x:Bind OxyForeground}"
                                    TicklineColor="{x:Bind OxyForeground}"
                                    TitleColor="{x:Bind OxyForeground}" />
            </oxyplot:PlotModel.Axes>
            <oxyplot:PlotModel.Series>
                <series:BarSeries LabelPlacement="Inside"
                                    LabelFormatString="{}{0:0.00}"
                                    TextColor="{x:Bind OxyText}"
                                    FillColor="{x:Bind OxyFill}" />
            </oxyplot:PlotModel.Series>
        </oxyplot:PlotModel>
    </oxy:PlotView.Model>
</oxy:PlotView>
Apart from the OxyColor and OxyThickness values we were able to define the whole diagram in XAML. Thats not too bad for a prerelease NuGet package…
When the page is loaded in the sample app, we fill out the missing declarations, and update the diagram’s UI:
var plotModel = Diagram.Model;
plotModel.PlotAreaBorderThickness = new OxyThickness(1, 0, 0, 1);
Diagram.InvalidatePlot();
Adding the data
After the evaluation of the classification model, we iterate through the quality metrics. We create a BarItem for each language. All items are then added to the series:
var bars = new List<BarItem>();
foreach (var logloss in metrics.PerClassLogLoss)
{
    bars.Add(new BarItem { Value = logloss });
}

(plotModel.Series[0] as BarSeries).ItemsSource = bars;
plotModel.InvalidatePlot(true);
The sample app
The sample app lives here on NuGet. We take the opportunity here to proudly mention that it is featured in the ML.NET Machine Learning Community gallery.
Enjoy!
