This is the first in a series of articles on implementing Machine Learning scenarios in UWP apps. We will use
- ML.NET for defining, training, evaluating and running Machine Learning models,
- OxyPlot for visualizing the data, and
- we’re planning to bring in Math.NET for number crunching – if needed.
All of these are cross platform Open Source technologies, all of these are written in C#, all of these are free, and all of these can be used on the UWP platform, albeit with some -hopefully temporary- restrictions.
Currently the large majority of the online samples on ML.NET are straightforward console apps. That’s fine if want to learn the API, but we want to figure out how ML.NET behaves in a more hostile enterprise-ish environment – where calculations should not block the UI, data should be visualized in sexy graphs, and architectural constraints may apply. With that in mind, we created a sample UWP MVVM app on GitHub, with pages covering different Machine Learning use cases, like
- building and using models for clustering, classification, and regression, and
- analyzing the input data that is used to train these models (that’s what data scientists call feature engineering).
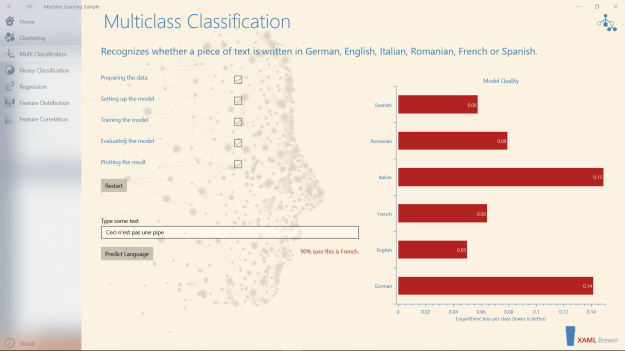
Here’s a screenshot from that app:
Machine Learning
Machine learning is a data science technique that allows computers to use existing data to forecast future behaviors, outcomes, and trends. Using machine learning, computers learn without being explicitly programmed. The forecasts and predictions are produced by so called ‘models’ that are upfront defined, trained with test data, evaluated, persisted, and then called upon in client apps.
Typical Machine Learning implementations include (source: Princeton):
- optical character recognition: categorize images of handwritten characters by the letters represented
- face detection: find faces in images (or indicate if a face is present)
- spam filtering: identify email messages as spam or non-spam
- topic spotting: categorize news articles (say) as to whether they are about politics, sports, entertainment, etc.
- spoken language understanding: within the context of a limited domain, determine the meaning of something uttered by a speaker to the extent that it can be classified into one of a fixed set of categories
- medical diagnosis: diagnose a patient as a sufferer or non-sufferer of some disease
- customer segmentation: predict, for instance, which customers will respond to a particular promotion
- fraud detection: identify credit card transactions (for instance) which may be fraudulent in nature
- weather prediction: predict, for instance, whether or not it will rain tomorrow
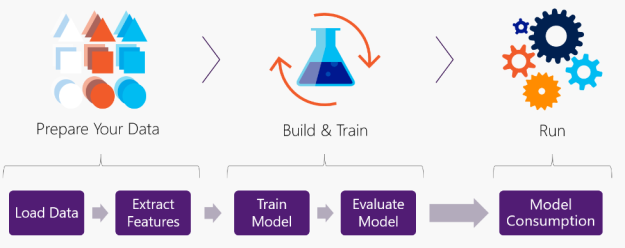
Well, this is exactly what ML.NET covers, and here are the steps to build all of these scenarios:
The domain of machine learning (and data science in general) is currently dominated by two programming languages: Python (with tools like scikit-learn) and R. These are great environments for data scientists, but are not targeted to developers. Enter ML.NET.
ML.NET
ML.NET is not the first Machine Learning environment from Microsoft (think of the Data Mining components of SQL Server Analysis Services, Cognitive Toolkit, and Azure Machine Learning services), but it is the first framework that targets application developers. ML.NET brings a large set of model-based Machine Learning analytic and prediction capabilities into the .NET world. The framework is built upon .NET Core to run cross-platform on Linux, Windows and MacOS. Developers can define and train a Machine Learning models or reuse an existing models by a 3rd party, and run it on any environment offline.
ML.NET is mature …
The origins of the ML.NET library go back many years. Shortly after the introduction of the Microsoft .NET Framework in 2002, Microsoft Research began a project called TMSN (“text mining search and navigation”) to enable developers to include ML code in Microsoft products and technologies. The project was very successful, and over the years grew in size and usage internally at Microsoft. Somewhere around 2011 the library was renamed to TLC (“the learning code”). TLC is widely used within Microsoft.
The ML.NET library started a descendant of TLC, with the Microsoft-specific features removed.
… but not finished yet
ML.NET 0.1 was announced at //Build 2018. The core functionality exists since 2002, so the first iterations probably focused on modernizing the C# code and hiding/removing the Microsoft-specific stuff. In version 0.5 a large portion of the original pipeline API with concepts such as Estimators, Transforms and DataView was moved to the Legacy namespace and replaced by one that is more consistent with well-known frameworks like Scikit-Learn, TensorFlow and Spark. Version 0.7 removed the framework’s dependency on x64 devices. ML.NET is and is currently at v0.9. It was extended with feature engineering, further reducing the functionality gap with Python and R environments.
You find the ML.NET source code here on GitHub.
What about UWP?
UWP apps are safe to run and easy to install and uninstall in a clean way. To achieve this, they run in a sandbox
- with a reduced API surface where some Win32 an COM calls are not accessible or even available, and
- within a security context that restricts access to the external environment (file system, processes, external devices).
When experimenting with ML.NET in UWP we observed the following handful of issues:
- ML.NET uses Reflection.Emit, which is not allowed in the native compilation step that occurs when compiling UWP apps in release mode,
- ML.NET uses the MEF composition container from v0.7 onwards, and not al MEF classes are exposed to UWP yet (a known issue), and
- ML.NET does file and process manipulations on classic API’s that are not available in UWP because of the sandbox, or because they live in a different namespace.
These issues are known by the different teams at Microsoft and we believe that they will be tackled sooner or later (the issues, not the teams ![]() ). In the mean time we’ll stick to version v0.6. Don’t worry: the v0.6 NuGet package has most of the core functionality (load and transform training data into memory, create a model, train the model, evaluate and save the model, use the model) and algorithms, but not the latest API.
). In the mean time we’ll stick to version v0.6. Don’t worry: the v0.6 NuGet package has most of the core functionality (load and transform training data into memory, create a model, train the model, evaluate and save the model, use the model) and algorithms, but not the latest API.
Clustering
Clustering is a set of Machine Learning algorithms that help to identify the meaningful groups in a larger population. It is used by social networks and search engines for targeting ads and determining relevance rates. Clustering is a subdomain of unsupervised learning. Its algorithms learn from test data that has not been labeled, classified or categorized. Instead of responding to feedback, unsupervised learning algorithms identify commonalities in the data and react based on the presence or absence of such commonalities in each new piece of data.
These diagrams show what clustering does: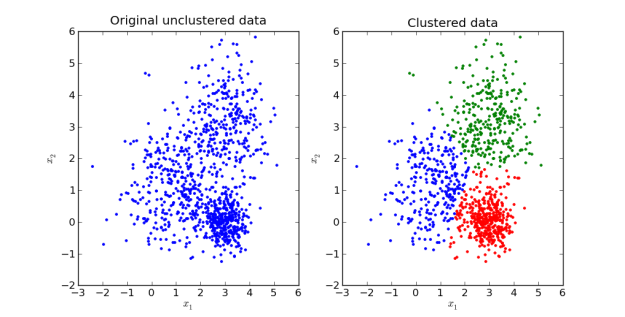
Most courses and handbooks on Machine Learning start with clustering, because it’s easy compared to the other algorithms (no labeling, no evaluation, easy visualization if you stick to less than 4D).
So it makes sense to start this ML.NET-OxyPlot-UWP series with a article on clustering.
ML.NET algorithms
There is a few clustering algorithms available, but the K-Means family is the most used, and that’s what ML.NET provides. K-means is often referred to as Lloyd’s algorithm. It takes the number of wanted clusters (‘k’) as its primary input. The algorithm has three steps. It executes the first step and then starts looping between the other two:
- The first step chooses the initial centroids, with the most basic method being to choose k samples from the dataset.
- The second step assigns each sample to its nearest centroid.
- The third step creates new centroids by taking the mean value of all of the samples assigned to each previous centroid.
The algorithm iterates through steps 2 and 3 until the position of the centroids stabilizes.
Enough talking, let’s get our hands dirty
Prepare the Solution
The sample app started as a new UWP app, with the following NuGet packages:
- ML.NET v0.6 (because higher versions don’t work for UWP)
- OxyPlot latest UWP prerelease
- .NET Core latest prerelease (because we want to see if and when bugs are fixed)
- LottieUWP (because we want to show a fancy animation while calculating)
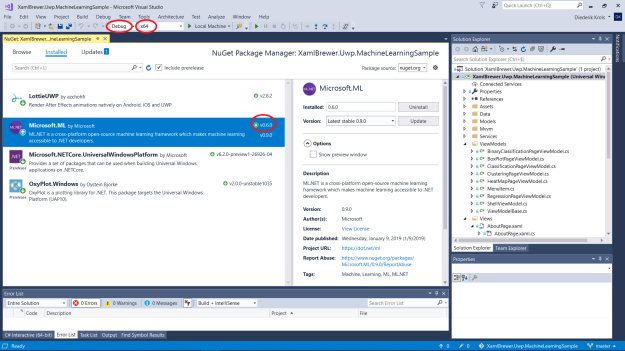
As already mentioned we stay in debug mode to avoid Reflection issues, and we target x64 architecture only since we use a pre-v0.7 version of ML.NET.
Solution Architecture
The Visual Studio solution uses a lightweight MVVM-architecture where the
- Models contain all business logic, the
- ViewModels make the models accessible to the Views, the
- Views focus on UI only, and the
- Services take care of everything that doesn’t fit the previous categories.
As a result, the MVVM Model classes contain code that is pretty close to the existing ML.NET Console app samples. Here’s for example how a Machine Learning Model is trained:
public void Train(IDataView trainingDataView)
{
    Model = Pipeline.Fit(trainingDataView);
}
In general, MVVM ViewModels make the models accessible to the UI by enabling data binding and change propagation. Machine Learning scenarios typically work with large data files and they run CPU-intensive processes. In the sample app the ViewModels are responsible for pushing all that heavy lifting off the UI thread to keep app responsive while calculating.
Here’s the pattern: all the model’s CPU-bound actions are made awaitable by wrapping them in a Task. Here’s how such a call looks like:
public Task Train(IDataView trainingDataView)
{
    return Task.Run(() =>
    {
        _model.Train(trainingDataView);
    });
}
This allows the Views to remain responsive. It can update controls and start animations while calculations are in progress. Here’s how a XAML page updates its UI and then starts training a model:
TrainingBox.IsChecked = true;
await ViewModel.Train(trainingDataView);
Nothing fancy, right? Well: if you would train the model synchronously, the checkbox would only update after the calculation.
Let’s start with a hack
UWP has its own file API with limited access to the drives and its own logical URI schemes to refer to the files. ML.NET is based on the .NET Standard specification, and uses the classic API’s with physical file paths. So we decided to add a helper method that takes a UWP file reference (think ‘ms-appx:///something’), copies the file to local app storage, and then returns the physical path that classic API’s know and love. Here’s that helper:
public static async Task<string> FilePath(string uwpPath)
{
    var originalFile = await StorageFile.GetFileFromApplicationUriAsync(new Uri(uwpPath));
    var storageFolder = ApplicationData.Current.LocalFolder;
    var localFile = await originalFile.CopyAsync(storageFolder, originalFile.Name, NameCollisionOption.ReplaceExisting);
    return localFile.Path;
}
Let’s now dive into ML.NET.
Load the data
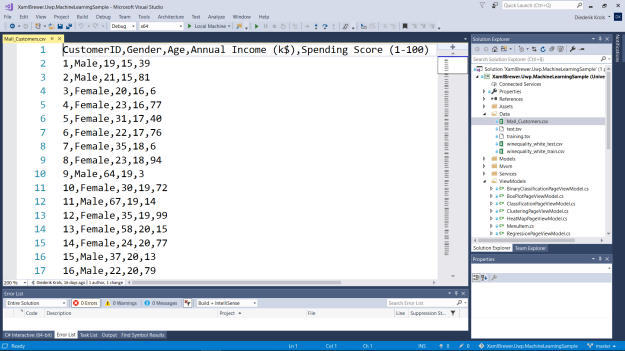
In this first scenario we will divide a group of shopping mall customers (borrowed from this Python sample) into 5 clusters. The raw data contains records with a customer id, gender, age, annual income, and a spending score. Notice that we’re in an unsupervised learning environment, so the data is ‘unlabeled’ – there is no cluster id column to learn from:
The MLContext class is central in the recent ML.NET API’s (sort of DBContext in Entity Framework). In v0.6 it was still called LocalEnvironment. We need an instance of it to share across components:
private LocalEnvironment _mlContext = new LocalEnvironment(seed: null); // v0.6;
The following code snippet from the MVVM Model shows how a TextLoader is used to describe the content of the file, read it, and return its schema as an IDataView:
public IDataView Load(string trainingDataPath)
{
    var reader = new TextLoader(_mlContext,
                                new TextLoader.Arguments()
                                {
                                    Separator = ",",
                                    HasHeader = true,
                                    Column = new[]
                                        {
                                            new TextLoader.Column("CustomerId", DataKind.I4, 0),
                                            new TextLoader.Column("Gender", DataKind.Text, 1),
                                            new TextLoader.Column("Age", DataKind.I4, 2),
                                            new TextLoader.Column("AnnualIncome", DataKind.R4, 3),
                                            new TextLoader.Column("SpendingScore", DataKind.R4, 4),
                                        }
                                });

    var file = _mlContext.OpenInputFile(trainingDataPath);
    var src = new FileHandleSource(file);
    return reader.Read(src);
}
The ML.NET algorithms only support the data types that are listed in the DataKind enumeration. The properties that we’re interested in (AnnualIncome and SpendingScore) are defined as float. In general, Machine Learning doesn’t like double because its values take more memory and the extra precision does not compensate that.
Here’s the call from the MVVM View. We read a file from the app’s Data folder, make a copy of it to the local storage, and pass the full path to the ML.NET code above:
// Prepare the files.
var trainingDataPath = await MlDotNet.FilePath(@"ms-appx:///Data/Mall_Customers.csv");

// Read training data.
var trainingDataView = await ViewModel.Load(trainingDataPath);
The returned IDataView does deferred execution similar to Enumerable in LINQ. The data is only physically read when it is consumed – in this case when training the model.
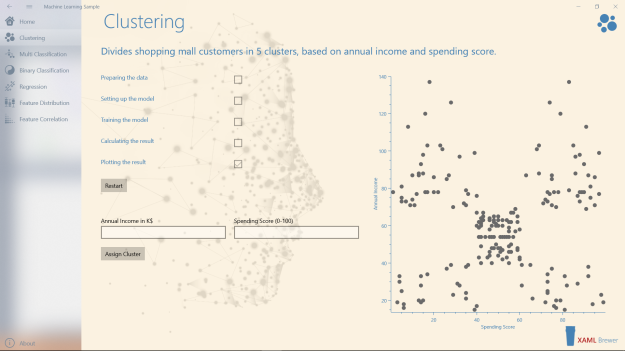
Here’s the raw data in a diagram:
Extract the features
In the second step of this Machine Learning scenario, we prepare the input data and define the algorithm that will be used. These steps are combined into a ‘Learning Pipeline’ that represents the untrained model.
First we plug in a ConcatEstimator to ‘featurize’ the data. We enrich the input data with properties of the name and the type that the algorithm expects. The Clustering model looks for a single column called “Feature” with an expected data type. We create this from the columns that we want to cluster on: AnnualIncome and SpendingScore.
The last step in the pipeline represents the algorithm and defines the type of pipeline – the T in EstimatorChain<T>. in a Clustering scenario we will use a KMeansPlusPlusTrainer. The most important parameter is the number of clusters.
Here’s how the pipeline is created:
public void Build()
{
    Pipeline = new ConcatEstimator(_mlContext, "Features", "AnnualIncome", "SpendingScore")
        .Append(new KMeansPlusPlusTrainer(
            env: _mlContext,
            featureColumn: "Features",
            clustersCount: 5,
            advancedSettings: (a) =>
                {
                    // a.AccelMemBudgetMb = 1;
                    // a.MaxIterations = 1;
                    // a. ...
                }
            ));
}
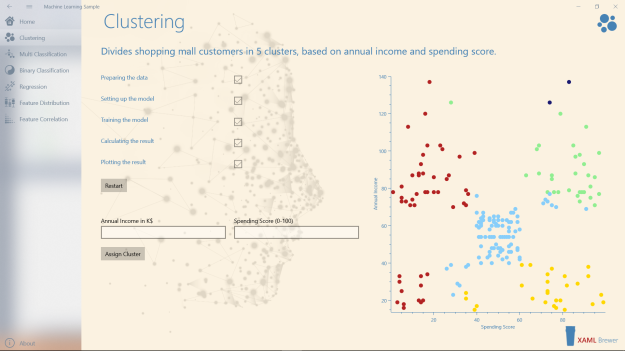
The advanced settings parameter allows you to fine-tune the algorithm, e.g. to optimize it for speed or memory consumption. Of course this comes with a price: the quality of the model will decrease. Here’s what happens when you restrict the number of iterations to just one:
The initial centroids were used and never moved, so we ended up with green dots within the red cluster,and a dark blue cluster with only two dots.
In a production environment you would iterate through different algorithms and different configurations to create a model that fits your need and does not kill the hardware. It’s good to see that ML.NET supports this.
Train the model
The Machine Learning model is created and trained by feeding the pipeline with the training data using a Fit() call. In the ML.NET API that’s just a one-liner, but behind it is a very complex and CPU-intensive task:
public void Train(IDataView trainingDataView)
{
    Model = Pipeline.Fit(trainingDataView);
}
The resulting model -a TransformerChain<T>– can be immediately used for prediction, or it can be serialized for later use.
Evaluate the model
In the common Machine Learning scenarios we would use two data sets: one to train the model, and another for evaluation. Since clustering belongs to unsupervised learning, there’s no reference data set to evaluate the model.
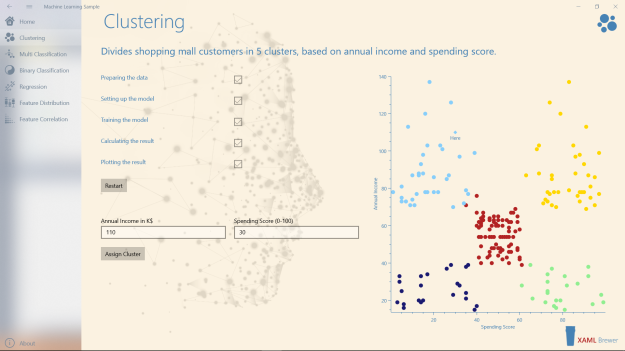
That’s why we have used a data set that allows easy visual inspection. When looking at the diagram, it is pretty obvious to figure out where the five clusters should be. Observe that the KMeans algorithm with standard settings did a good job:
Persist the model
The trained model can be persisted to a .zip file for later use or for use on another device with a simple call to the (oddly synchronous) SaveTo() method:
public void Save(string modelName)
{
    var storageFolder = ApplicationData.Current.LocalFolder;
    using (var fs = new FileStream(
            Path.Combine(storageFolder.Path, modelName),
            FileMode.Create,
            FileAccess.Write,
            FileShare.Write))
    {
        Model.SaveTo(_mlContext, fs);
    }
}
Use the model
A trained model’s main purpose it to create predictions based on its input, so we need to define some classes to describe that input and output.
The class that describes the predicted result may contain all input fields (in our sample “AnnualIncome” and “SpendingScore”) and the algorithm-specific output. The KMeans algorithm spawns records with a “PredictedLabel” holding the most relevant cluster id and ”Score”, an array with the distances to the respective centroids.
You can use the ColumnName attribute to shape your own data types to these expectations:
    public class ClusteringPrediction
    {
        [ColumnName("PredictedLabel")]
        public uint PredictedCluster;

        [ColumnName("Score")]
        public float[] Distances;

        public float AnnualIncome;

        public float SpendingScore;
    }
Here’s the class that we use to store a single input point:
public class ClusteringData
{
    public float AnnualIncome;

    public float SpendingScore;
}
There are at least two ways to use the model for assigning clusters to input data
- the Transform(IDataView) applies the transformation to a whole set of data, and there is also
- the MakePredictionFunction<Tsrc, Tdst> (an extension method that is now called CreatePredictionEngine<Tsrc, Tdst>). This is a strongly typed method to create a prediction from a single input.
Here’s how both calls are used in the sample app:
public IEnumerable<ClusteringPrediction> Predict(IDataView dataView)
{
    var result = Model.Transform(dataView).AsEnumerable<ClusteringPrediction>(_mlContext, false);
    return result;
}

public ClusteringPrediction Predict(ClusteringData clusteringData)
{
    var predictionFunc = Model.MakePredictionFunction<ClusteringData, ClusteringPrediction>(_mlContext);
    return predictionFunc.Predict(clusteringData);
}
To color the graph in the sample, we asked the model to assign a cluster to each record in the training dataset:
var predictions = await ViewModel.Predict(trainingDataView);
This creates a list of predictions with the input fields and the assigned cluster. That’s what we used to populate the diagram.
The sample page also comes with two textboxes where you can fill out values for annual income and spending score. The trained model will assign the cluster to it. Here’s how that call looks like:
int.TryParse(AnnualIncomeInput.Text, out int annualIncome);
int.TryParse(SpendingScoreInput.Text, out int spendingScore);
var output = await ViewModel.Predict(
	new ClusteringData
	{
		AnnualIncome = annualIncome,
		SpendingScore = spendingScore
	});
The result is a single prediction.
At this point in the scenario, most op the ML.NET sample app do Console.WriteLine of the predictions and then stop. But we’re in a UWP app, so we can have a lot more fun. Let’s add some sexy diagrams!
Visualizing the results
Introducing OxyPlot
OxyPlot is an open source plot generation library. It started in 2010 as a simple WPF plotting component, focusing on simplicity, performance and visual appearance. Today it targets multiple .NET platforms through a portable library, making it easy to re-use plotting code on different platforms. The library has implementations for WPF, Windows 8, Windows Phone, Windows Phone Silverlight, Windows Forms, Silverlight, GTK#, Xwt, Xamarin.iOS, Xamarin.Android, Xamarin.Forms, Xamarin.Mac … aaaand … UWP.
OxyPlot is primarily focused on two-dimensional coordinate systems, that’s the reason for the ‘xy’ in the name! Some of its restrictions are
- lack of support for 3D plots,
- no animations, and
- supports data binding, but you must manually refresh the plots when changing your data.
The documentation is a work in progress that stalled somewhere back in 2015, but since then the OxyPlot team published more than enough example source code on any diagram type, and there are ‘getting started’ guides for all targeted technology stacks, including UWP and Xamarin.
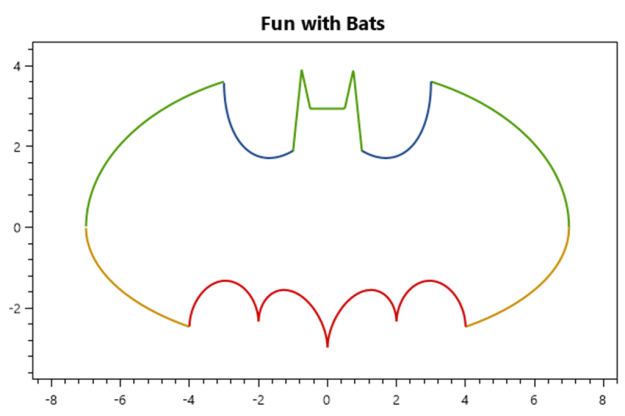
OxyPlot ‘s API comes with all types of axes (linear, logarithmic, radial, date, time, category, color), series (area, bar, boxplot, candlestick, function, heat map, contour and many more) and annotations (point, rectangle, image, line, arrow, text, etc.) that you can think of. On top of that, it handles the Batman Equation correctly:
PlotView
The only UI control in the package is PlotView. It’s not really documented, but apart from the PlotModel which hosts the content it doesn’t have much properties after all – just look at the source code.
Since we will create everything in the sample app programmatically, the XAML is rather lean:
<oxy:PlotView x:Name="Diagram"
                Background="Transparent"
                BorderThickness="0" />
Axes
To represent the clusters, we will use two linear axes: a horizontal for the SpendingScore and a vertical for the AnnualIncome. Here’s how these are defined:
var foreground = OxyColors.SteelBlue;
var plotModel = new PlotModel
{
    PlotAreaBorderThickness = new OxyThickness(1, 0, 0, 1),
    PlotAreaBorderColor = foreground
};

var linearAxisX = new LinearAxis
{
    Position = AxisPosition.Bottom,
    Title = "Spending Score",
    TextColor = foreground,
    TicklineColor = foreground,
    TitleColor = foreground
};

plotModel.Axes.Add(linearAxisX);
var linearAxisY = new LinearAxis
{
    Maximum = 140,
    Title = "Annual Income",
    TextColor = foreground,
    TicklineColor = foreground,
    TitleColor = foreground
};
plotModel.Axes.Add(linearAxisY);
Please note that we could have defined this in XAML too.
Series
The dots that represent the training data are assigned to 5 ScatterSeries instances (one per cluster). Each series comes with its own color:
for (int i = 0; i < 5; i++)
{
    var series = new ScatterSeries
    {
        MarkerType = MarkerType.Circle,
        MarkerFill = _colors[i]
    };

    plotModel.Series.Add(series);
}
All we need to do now to prepare the diagram, is hook the PlotModel into the PlotView:
Diagram.Model = plotModel;
To (re)plot the diagram, we loop through the list of predictions on the training dataset, create a new ScatterPoint for each prediction, and add it to the appropriate cluster series:
foreach (var prediction in predictions)
{
    (Diagram.Model.Series[(int)prediction.PredictedCluster - 1] as ScatterSeries).Points.Add(
        new ScatterPoint
        (
            prediction.SpendingScore,
            prediction.AnnualIncome
        ));
}
foreach (var prediction in predictions)
{
(Diagram.Model.Series[(int)prediction.PredictedCluster - 1] as ScatterSeries).Points.Add(
new ScatterPoint
(
prediction.SpendingScore,
prediction.AnnualIncome
));
}
When this code is executed you’ll see … nothing. You need to tell the diagram that its content was updated:
Diagram.InvalidatePlot();
Now you end up with the 5 colored clusters that we’ve seen before:
Annotations
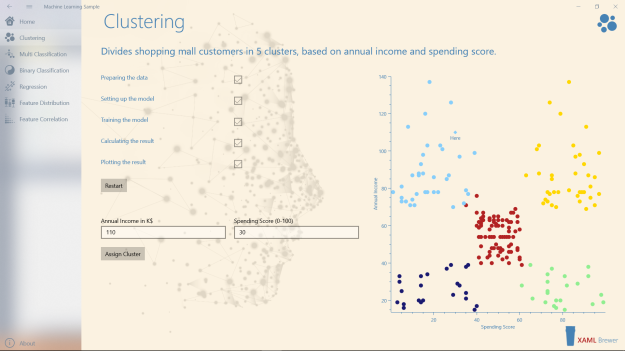
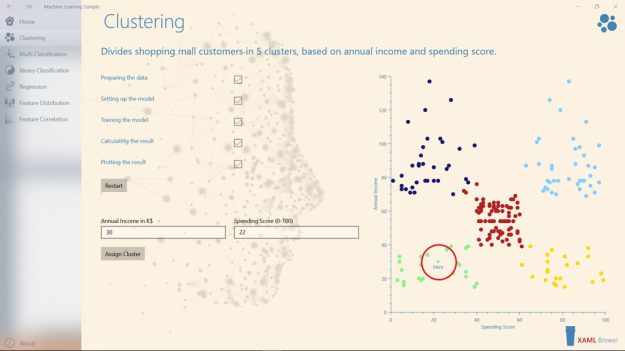
The extra dot for the single prediction is visualized as a PointAnnotation. We gave it the color of the assigned cluster, but a different shape and an extra label to easily spot it in the diagram:
var annotation = new PointAnnotation
    {
        Shape = MarkerType.Diamond,
        X = output.SpendingScore,
        Y = output.AnnualIncome,
        Fill = _colors[(int)output.PredictedCluster - 1],
        TextColor = OxyColors.SteelBlue,
        Text = "Here"
    };
Diagram.Model.Annotations.Add(annotation);
Diagram.InvalidatePlot();
Here’s how this looks like:
To finish this article, let’s promote some extra OxyPlot features.
Tracker
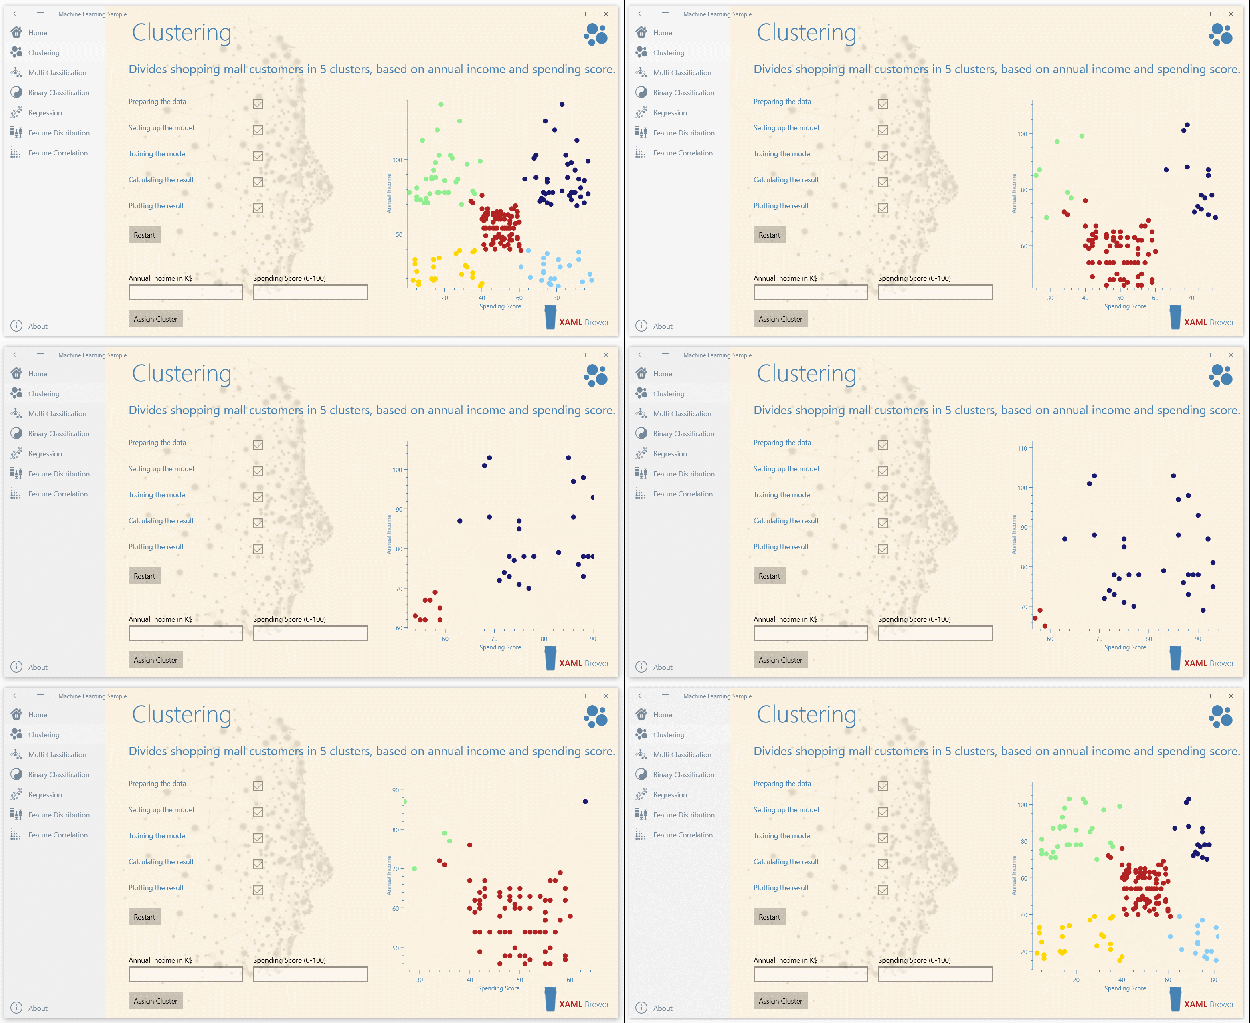
OxyPlot comes with a templatable tracker. By default it appears when you left-click on an item in a series, but you can also make it permanently visible. It shows a crosshair and the details of the underlying item, very convenient:
Zooming and Panning
By scrolling the mouse wheel you can zoom in and out, and with the right mouse button down you can pan the diagram:
You want more?
This was just the first of a list of articles on ML.NET in UWP. Until now, we are very impressed!
If you want to play with the sample app, it lives here on GitHub.
Enjoy!
Very informative and helpful. Finally a non-Console example. Exposure to the OxyPlot is great. For the “Regression Sample” , will the “Prediction” capability be completed?
Thanks again.
LikeLike
Thanks! Every page in the sample app will be completed as far as I can go with this version of the API.
LikeLike